- Background
- The UK’s technology and innovation centre Transport System Catapult, together with the Royal College of Art and Commonplace Ltd., worked on a feasibility study on the use of sentiment analysis to improve the way transport operators manage their services. Transport companies have countless ways for transmitting information to travellers – billboards, signs, displays, announcements, etc. When it comes to getting information from the users, their means are limited. Could the joys and frustration that commuters share on Twitter serve as a feedback channel?
- Process
-
I was asked do a preliminary study on the kinds of insights that Twitter data could provide in this context. Based on a sample set of 15,000 tweets, I produced three visualisation prototypes that exposed geographic, temporal and linguistic patterns. These prompted the Transport System Catapult to commission a live dashboard for their own use.
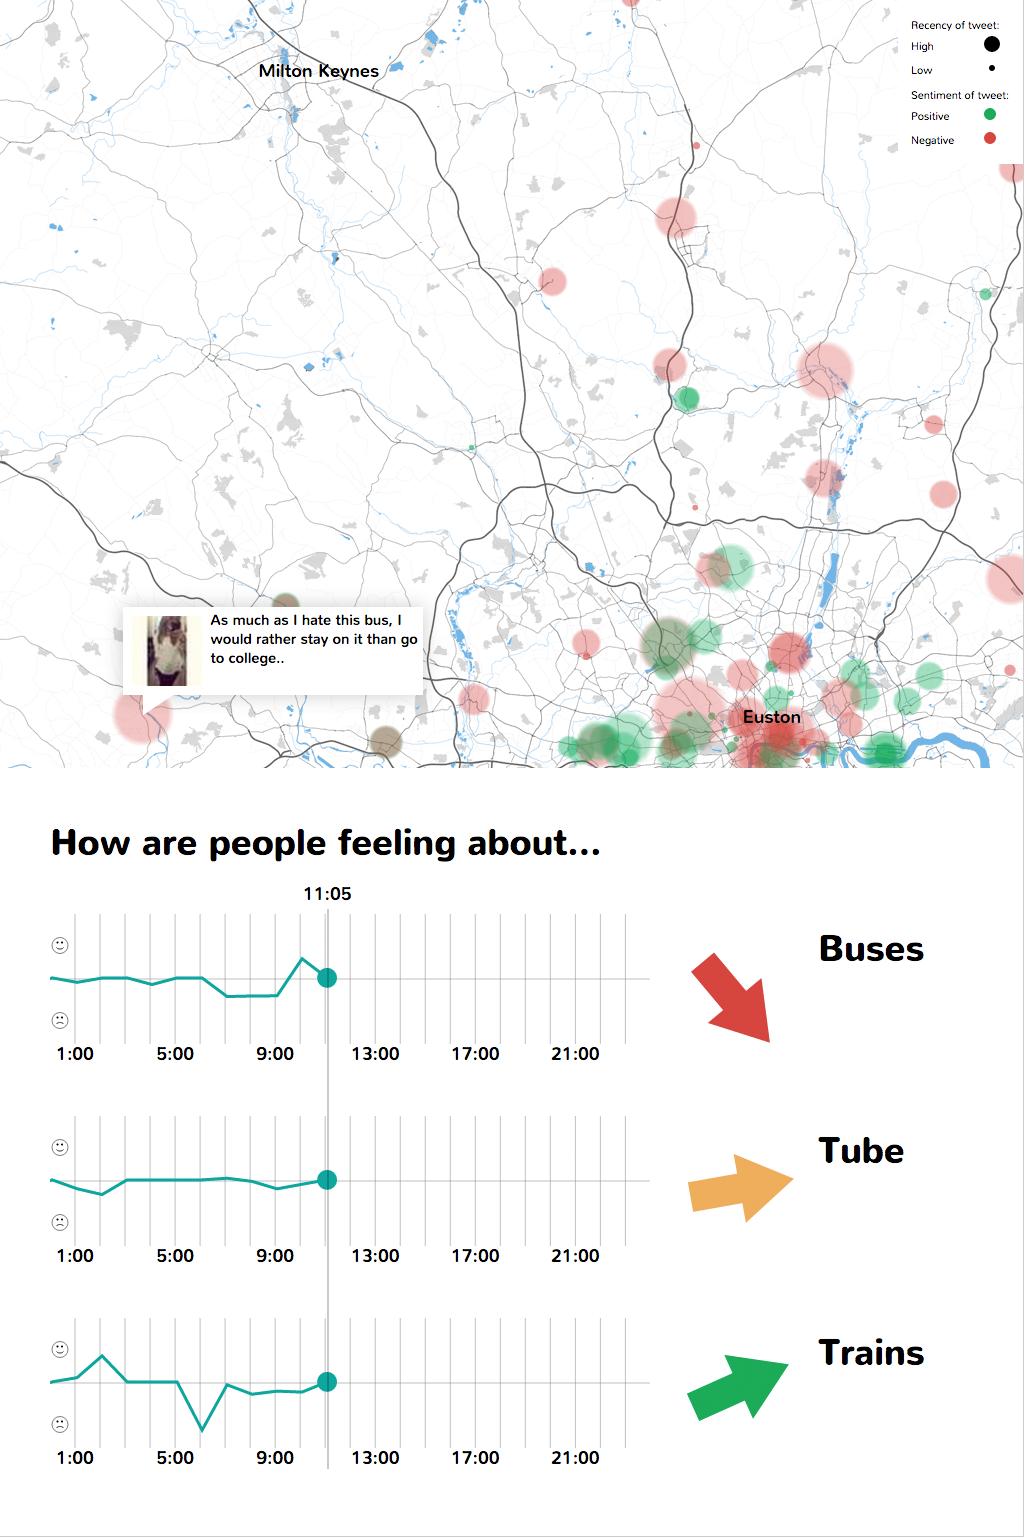
The dashboard should monitor Twitter users’ sentiments within the geographic area between London and Milton Keynes, where TSC have their headquarters. Furthermore, it should distinguish between different modes of transport: buses, trains and the London Underground. Both requirements meant that the available data was much smaller than in the sample dataset. Only a small portion of all Tweets carry geographic data and only a tiny subset of those falls within the monitored region. Filter out the ones that are not related to transport and you’re left with barely a hundred tweets per day.
Creating a meaningful display with such a small dataset was challenging and it being live meant that not very much was happening most of the time. We therefore decided to always display all the data of the current day.
- Results
-
The project received great media attention, with articles in The Guardian and on CNN, and is set to be put to use by integrating more sources of data. CNN writes:
This is about how to improve journeys in the future,” says David Reid, a spokesperson for the Transport System Catapult. “The way you get from A to B often involves loads of different methods of transport — you might walk, take the bus, train, bicycle; how do you make all those different modes of transport more connected, how do we use emerging technologies like GPS, satellite technology, mobile phones, open data or sentiment mapping and how do we use these technologies to improve transport systems.